Unity's IPO: What are the customer analytics of a game engine?
Unity Software Inc. recently filed its S-1 in advance of going public. Unity is the maker of a real-time 3D game engine that powers many 3D games and other content across numerous sectors. In this post, I focus on an under-discussed part of its IPO disclosure: its customer analytics.
Contents
- A customer-cohort-chart, sort of
- Filling in the gaps
- Insights:
- 1) A customer base with long lifetimes
- 2) Growing customer cohort revenue over time
- 3) Healthy net revenue retention on both the cohort and aggregate level
- 4) Large customers comprise most of Unity’s revenue
- 5) Customer acquisition costs of $1.2 million in 2018 and $1.6 million in 2019
- 6) Estimated customer payback period of 3-4 years
- Conclusions
A customer-cohort-chart, sort of
In its S-1, Unity discloses a customer-cohort-chart (C3):
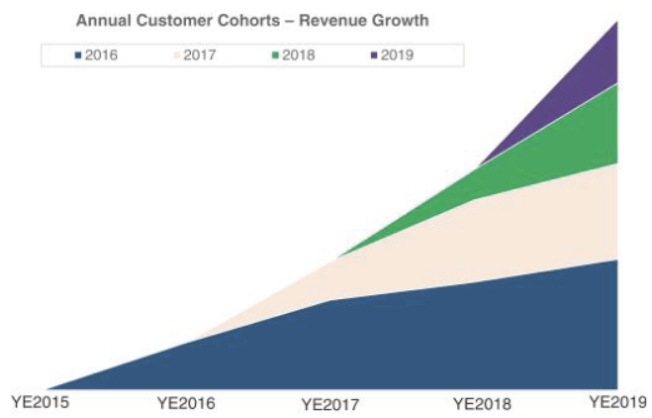
source: Unity Software S-1 Filing
These charts, as discussed in my Chewy IPO analysis, are incredibly insightful as they reveal so much about a company’s customer acquisition, retention, and spend.
At first glance, this chart looks pretty good: cohort revenue is increasing over time, which means that increasing customer spend is more than offsetting any churn. Each new cohort is entirely additive such that new customer acquisition is not required for growth.
…except there are two things missing on this chart. First, there is no y-axis (#chartcrime). Second, there is no pre-2016 cohort revenue.
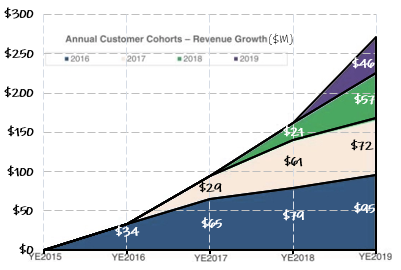
Filling in the gaps
Let’s fix that. Given that Unity discloses two data points for the 2018 cohort, we can easily populate the entire chart with very close approximations based on pixel length:
Since we now know the numbers for the above chart, we should be able to calculate pre-2016 cohort revenue by subtracting 2016-2019 cohort revenue from the total annual revenue disclosed elsewhere.
Unfortunately, we run into another problem with Unity’s disclosure: despite being around since 2004, there is no pre-2018 annual revenue disclosed!
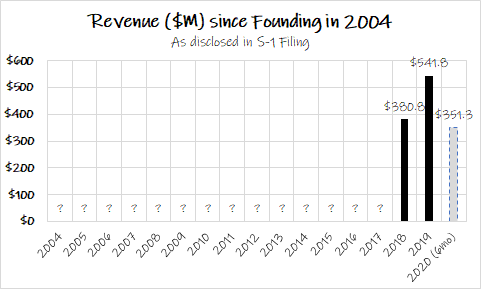
That's a lot of question marks
The reason for the lack of disclosure is because Unity is classified as an “Emerging Growth Company”, which allows it to disclose a minimum of just two years of financial reporting versus the typical five years, along with other reduced requirements.
From some other line items I was able to back out 2017 revenue of $290 million, but it is not possible to go back any further than that.
Putting all of this together, the x-axis shrinks to 2017 onward, but we can still add pre-2016 cohort revenue to the C3 chart resulting in a more complete picture:
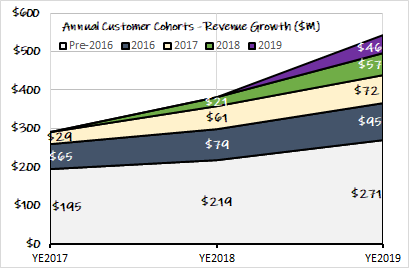
The complete picture
This chart, along with other disclosures, allows for further analysis and insights.
Insights:
1) A customer base with long lifetimes
Pre-2016 cohort revenue comprised exactly 50% of total revenue in 2019. This is reasonable given the company has been around for so long. Importantly, this means that Unity has many customers that have been with it for many years.
2) Growing customer cohort revenue over time
For recent cohorts, customer spend over time looks like this:
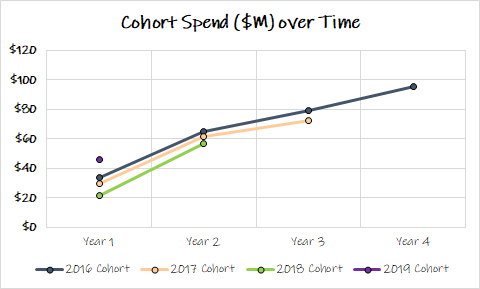
Interestingly, there was a slight downward trend in cohort revenue from 2016-2018, though that has been reversed with strong first year revenue from the 2019 cohort.
3) Healthy net revenue retention on both the cohort and aggregate level
Another way of looking at customer spend is net revenue retention (or “dollar-based net expansion rate”), which is above 100% for all of Unity’s cohorts, including the pre-2016 cohort:
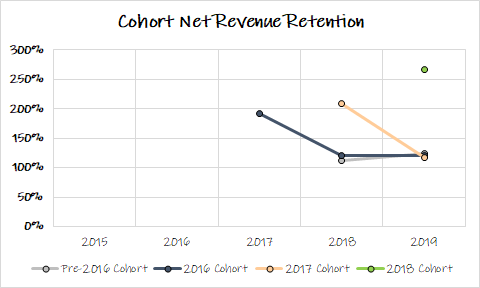
Each cohort seems to converge to the 120%-130% after one year and stabilize in that range.
This reconciles well with Unity’s reported disclosure at the corporate level (again, only for 2018 and later):
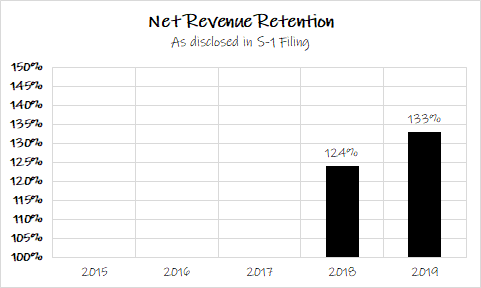
This means that 2019 revenue would have grown 33% without any new customers. Unity’s actual growth in 2019 was 42% because it did add new customers. Growth is much easier when it is already baked in from customers you already have.
A growing base of customers that spends more each year is why a company like Unity can put up stellar growth numbers, and generally speaking, is the key to the success of many SaaS companies. I believe it is also the key to understanding why SaaS companies typically trade at relatively high multiples.
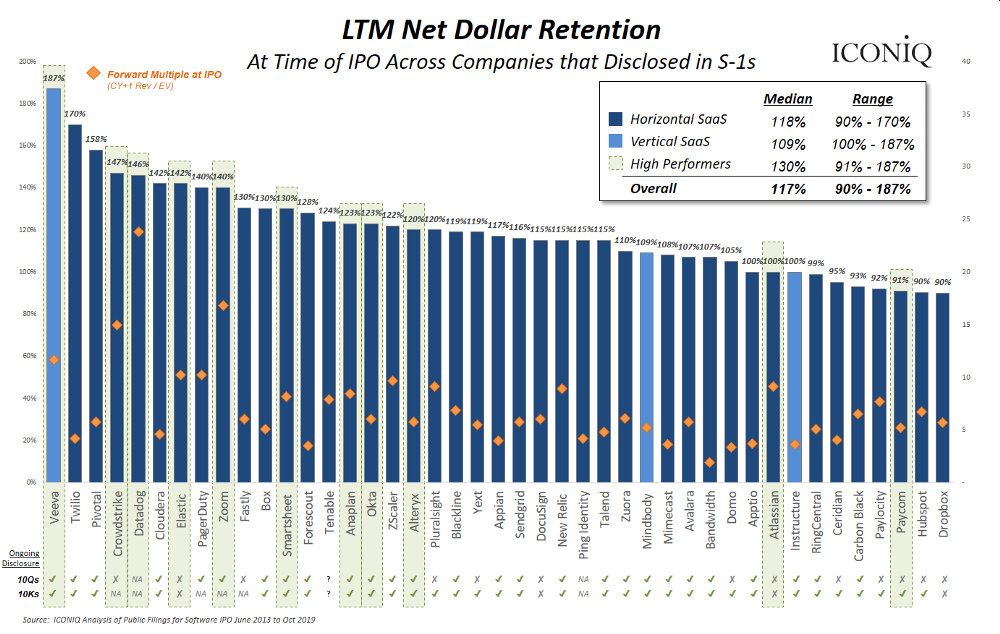
For perspective, 133% net dollar retention is fantastic and puts Unity near the high end of SaaS companies:
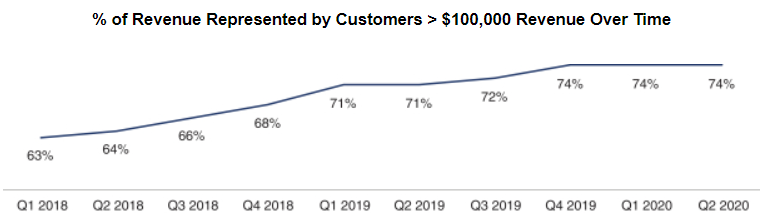
4) Large customers comprise most of Unity’s revenue
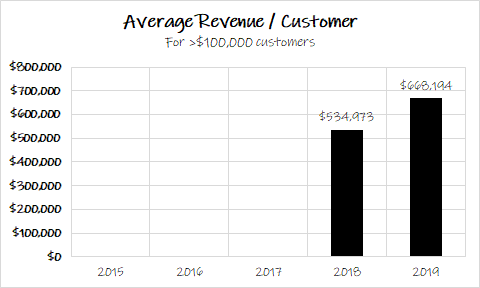
For the rest of the post, we will focus on Unity’s >$100,000 customers, as Unity uses this as a cut-off for some of its disclosures, including these two charts:

Some simple math gets us to average revenue of $668k per customer in 2019, an increase from $535k in 2018.
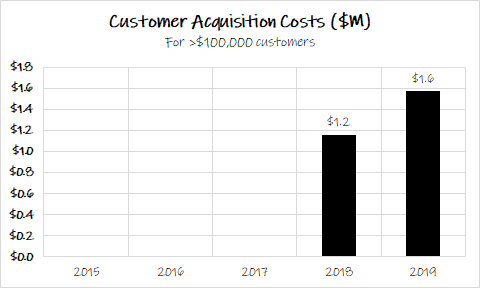
5) Customer acquisition costs of $1.2 million in 2018 and $1.6 million in 2019
Focusing on these >$100,000 customers, we can enable some analysis if we make the following assumptions:
- New >$100,000 customers are actually new “customers acquired” (even if they may have been customers in prior periods at a smaller scale).
- >$100,000 customer retention (past and future) is 99%. This is based on Unity’s only disclosure about customer retention in its entire S-1: “As of June 30, 2020, we had 716 of these >$100,000 customers and a gross retention rate of 99%”
- All marketing spend in a period is attributed to new >$100,000 customers. This is not the case in reality (marketing spend could also be attributed to the smaller customers and/or existing customers), but marketing expense as a capital investment is a useful way to think about CAC.
All of these are flawed, but it is the best we can do given the limitations.
Based on these assumptions and Unity’s disclosure about its number of >$100,000 customers, along with a small extrapolation for one quarter to get an estimate of the number of customers at the beginning of 2018, we can calculate that Unity added approximately 116 new >$100,000 customers in 2018 and approximately 111 new $100,000 customers in 2019.
Unity’s marketing expense was $134 million in 2018 and $174 million in 2019, resulting in CAC of $1.2 million in 2018 and $1.6 million 2019.
If all marketing expense is entirely attributed to new >$100,000 customers
$1.6 million per customer might seem like a lot, however these are large customers that spend at least $100,000 annually.
6) Estimated customer payback period of 3-4 years
Using the above information, we can calculate a payback period with a few additional assumptions:
- Contribution margin stays constant at the the 2019 level of 78.1%
- Cohort revenue continues to expand at 120% after year 2
This analysis results in an estimated payback period of 4 years for the 2018 cohort and 3 years for the 2019 cohort:

It is difficult to qualitatively assess how good this is without an NPV analysis and context around how long customers actually stick around, but this seems to be reasonably healthy given the nature of Unity’s business.
Conclusions
Without more disclosure it is difficult to go beyond this analysis to calculate other metrics such as customer lifetime value, NPV of a customer, and so on. Further, it would be difficult to turn this into a full-fledged customer-based corporate valuation model. That said, on the surface, Unity’s customer analytics and economics appear to be positive.
This post has been an exercise in what can be done with limited information and was mostly to satisfy my own curiosity piqued by an intriguing C3 chart with no y-axis. The scope of this post is limited and is not a comprehensive analysis of the company. This is a high-profile IPO so there are a lot of well-done pieces on the company such as this one or this one, which are good for further reading.
It will certainly be interesting to see Unity’s valuation at the IPO and how the company performs thereafter.
Disclaimer: This post is strictly for informational purposes only and should not be construed as investment advice or a recommendation to buy or sell any security. The views expressed herein are the author's alone and do not represent views of any organization or employer the author is currently or was previously associated with. Click here for full disclaimer.