BackBlaze's Customer Analytics
Customer cohort charts are becoming more popular. One of the latest is from BackBlaze, a cloud storage company for individuals and enterprises that has 480k customers and generated $53.8M in revenue last year. The company recently filed its S-1 in advance of its upcoming IPO with some interesting customer disclosure.
Here is the C3 chart:
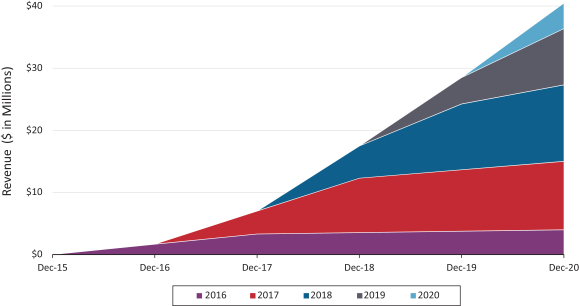
Source: BackBlaze S-1
On the surface, it looks compelling - the cohorts are increasing modestly over time providing a growing base of revenue.
But there is a lot missing from this chart.
Contents
Filling in the gaps
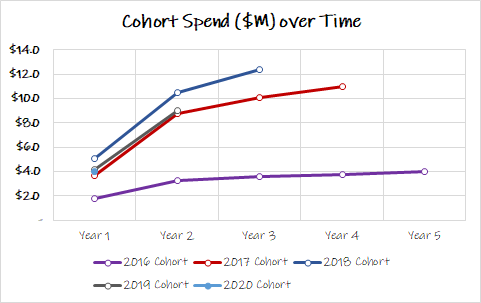
Before we can dive in, there is a key thing missing: pre-2016 cohort revenue. The company has been around since 2007 yet this chart only includes 2016 onwards, as evident by the just over $40M of 2020 revenue shown here versus the reported $53.8M.
The first thing we can do is extract each data point:
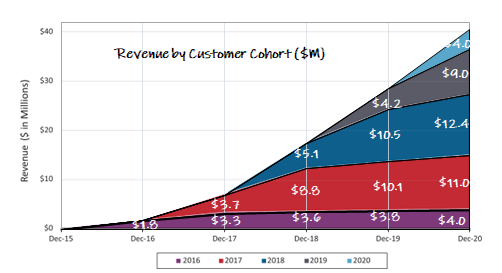
Note: approximations based on pixel length
Next, we can add in pre-2016 data by taking the difference between the totals in this chart and revenue in the financial statements.
However, we run into a small snag: the company only includes the last two calendar years of financials in its IPO filings because it elects to be classified as an “emerging growth company” which has lower disclosure requirements.
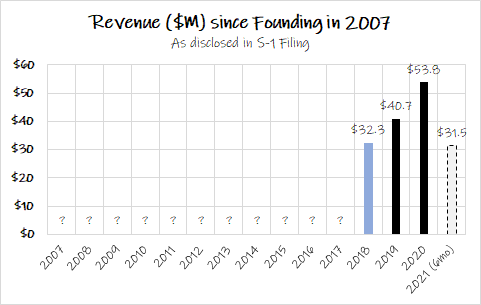
This disclosure rule should be changed.
2018 revenue is only available in an indirect way, but it can be backed out from some other line items.
So we’re stuck with just the last few years to do some of the more interesting analysis. But here is the shrinked-x-axis-but-full-version of the C3 chart with pre-2016 cohort included:
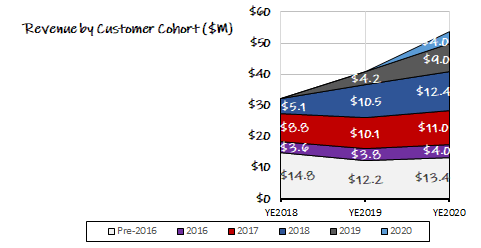
With that data cleanup done, we can do some customer analytics and generate some insights.
Insights:
1) Growing customer cohorts
Customer cohorts for BackBlaze grow over time, stacking nicely on top of each other to provide a strong foundation for future growth. The best thing about subscription businesses is that most of the revenue each year is recurring from existing customers - they don’t have to start from scratch each year with entirely new customers. And in many cases, revenue growth is already baked in (when Net Revenue Retention > 100%). More on this in a bit.
2) A modest-growth business over time
After the jump from year 1 to year 2, largely due to year 2 being the first full year for a customer, cohort spend growth moderates substantially in year 3 and beyond.
Normalizing these into % terms, here is what cohort spend looks like over time relative to first year spend:
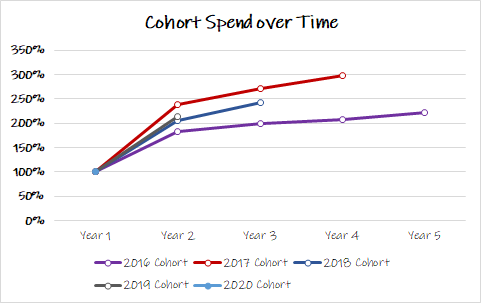
By calendar year, we can see that cohort revenue quickly moderates to high-single-digit-to-mid-teens annual growth.
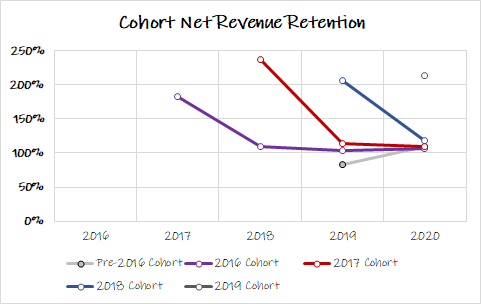
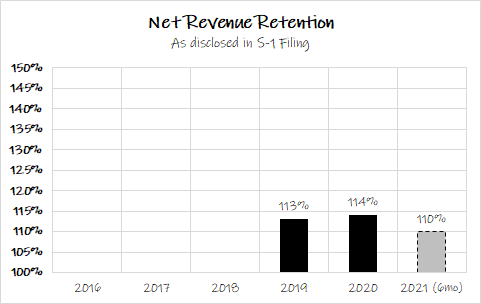
3) Net Revenue Retention of 114% in 2020
Net Revenue Retention (NRR) has been fairly stable in the last couple years at 113% in 2019 and 114% in 2020, with a decrease to 110% in the first six months of 2021. With context from the above charts, this makes sense given older cohorts growing at high-single digits, more recent cohorts growing around 15%, and the newest cohort getting the large second year increase.
For reference, the median NRR of cloud companies is 119%, with companies such as Snowflake (169%) and UiPath (144%) at the high end, and few such as Domo (90%) and BenefitFocus (95%) at the lower end.
It is worth noting that BackBlaze has two business lines: Computer Backup with $38.9M 2020 revenue and B2 Cloud Storage with $14.2M 2020 revenue.
While much smaller, the B2 Cloud Storage business is growing revenue at 61% with 130% NRR versus the Computer Backup business at 11% revenue growth and 104% NRR.
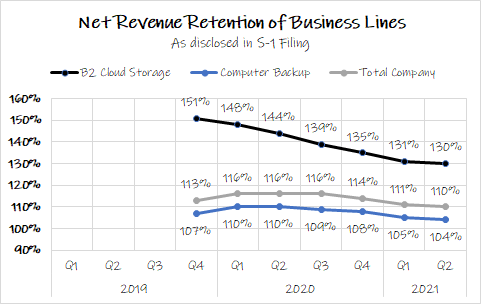
To the extent B2 is more of a focus going forward appears to be a positive direction for the company.
4) Customer churn and acquisition breakdown
The company reports ~90% gross retention rates. This number is on a blended basis, which most likely consists of somewhat higher churn from newer cohorts, and lower churn from later cohorts.
Overall, the company is losing ~10% of customers each year and adding ~20% new customers for net customer growth of ~10%, although customer growth is slowing in recent quarters (partly due to shift to higher value B2 customers).
We can further get a sense of the customer dynamics of the company by calculating churn and acquisition for the last few years:
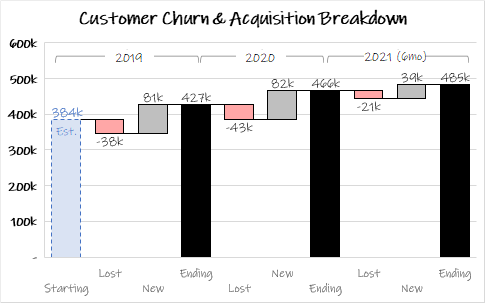
Note: 2019 starting customers is an estimate
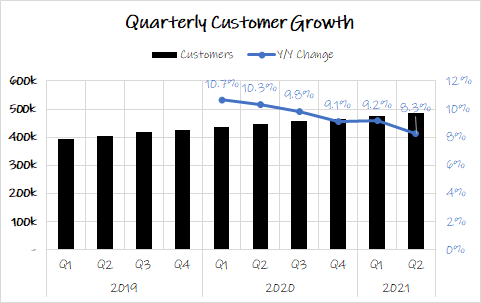
5) Slowing customer growth
To further illustrate the more recent trend in customer growth, here are the customers over the last ten quarters and the slowing Y/Y growth, which is now around 8%.
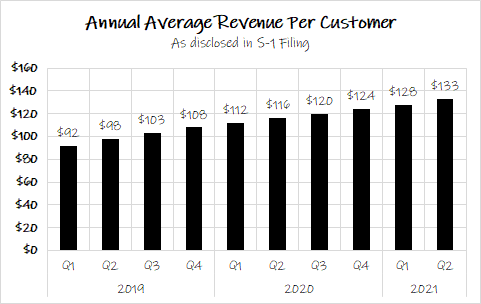
6) Growing ARPU
While overall customer growth may be slowing, it is noteworthy that average revenue per customer continues to grow at ~15% per year as the company increases pricing and the revenue mix shifts more towards the higher revenue B2 Cloud Storage business ($326 ARPU) from the core Computer Backup business ($99 ARPU).
7) Increasing Customer Acquisition Costs (CAC)
In 2020, BackBlaze spent $11.9M on sales & marketing to acquire 82k customers, equating to CAC of $145 per customer. This compares to CAC of $101 in 2020, when the company spent $8.2M to acquire almost the same number of customers (81k).
For the first half of 2021, CAC has continued to increase, now at $207 per customer. This is a concerning trend, although the company has been shifting towards the higher value B2 Cloud Storage business.
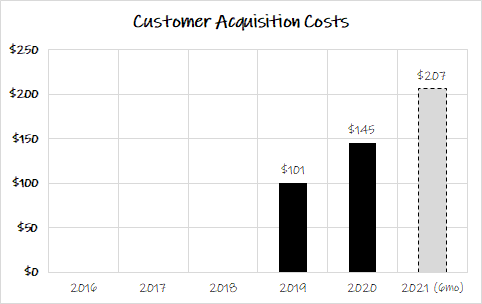
Note: this CAC calculation assumes 100% of sales & marketing is attributed to new customer acquisition. This is not entirely the case in reality, but it is a useful way to standardize and think about CAC.
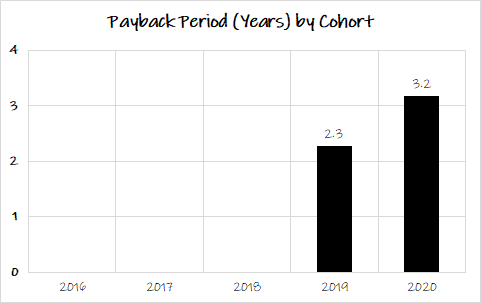
8) Customer Economics
We can calculate economics for the latest cohorts based on the following assumptions:
- Contribution margin stays flat at 2021 H1 level of 50%
- Cohort revenue continues to expand at 107% starting in year 3 and flattens out at 105% long term
This analysis results in 2.3 year payback for the 2019 cohort, increasing to 3.2 years for the 2020 cohort, which is on the longer end unless customer lifetimes are exceptionally long.
We can also calculate IRR and Post-Acquisition Value (PAV), although this assumes long customer lifetimes and that cohort revenue grows indefinitely, which is a significant assumption given there is variability in prior cohorts and a lot can change with software products.
With that caveat, this analysis results in a healthy 85% IRR, and 5.7x PAV/CAC for the 2019 cohort. For the 2020 cohort, these measures weaken to 51% IRR, and 3.6x PAV/CAC.
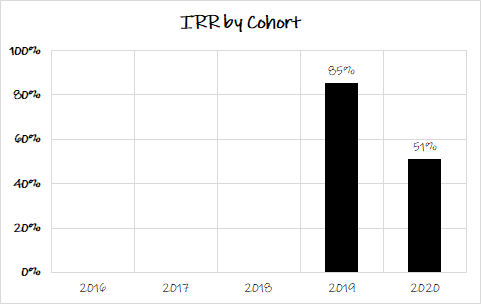
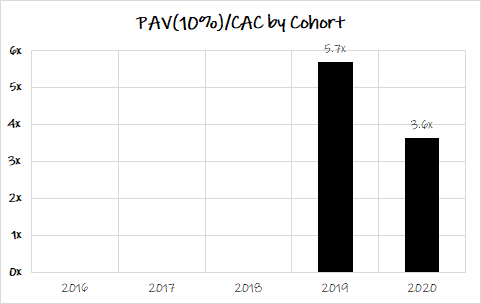
Keep in mind that these economics are at the customer level and aggregate cohort economics need to cover fixed costs for the company itself.
A one-year change is not enough to extrapolate, but the deteriorating trend from 2019 to 2020 is more concerning than the absolute economics themselves which are reasonable.
Conclusions
BackBlaze is expected to raise approximately $100M in its upcoming IPO under the ticker BLZE, with pricing of $15-$17 per share, which results in a fully-diluted market cap of $646M.
The company has built a $53.8M revenue business with positive customer economics, impressive especially considering only ~$13M of outside equity investment since inception (including the recent $10M SAFE). The most notable takeaway from the above analysis is the weakening trend in many of the measures over the last couple years, although with limited historical data, it is worth understanding these trends at a deeper level before extrapolating forward.
The next level of this analysis would be to calculate the present value of each current and future customer cohort, as well as the ongoing fixed/corporate costs, and roll that up into a customer-based corporate valuation. With such limited data, I will keep that outside the scope of this post. This exercise is mostly because I enjoy doing this sort of analysis and understanding customer analytics of various companies.
Further Reading:
Disclaimer: This post is strictly for informational purposes only and should not be construed as investment advice or a recommendation to buy or sell any security. The views expressed herein are the author's alone and do not represent views of any organization or employer the author is currently or was previously associated with. Click here for full disclaimer.