Chewy 5 Years Post-IPO: A Customer Analytics Update
In mid-2019, Chewy, the online pet retailer, went public with a $1B IPO, valuing the company at $9.3B. Shortly after, I published a comprehensive analysis of its customer analytics and valuation by fitting statistical models to the key customer processes of acquisition, retention, and spend.
If you’re reading this, there is a good chance you subscribed from that original post (Chewy’s IPO: Customer Analytics and Valuation using Probability Models). It remains my most popular and most linked piece - fitting, since it took the most work. It was an intensive effort to learn the technical nuances behind probability models and the Customer-Based Corporate Valuation1 methodology, develop my own framework for applying it, and build one of the most complex models I had ever built.
The 2019 analysis made several novel contributions at the time to understanding Chewy and its future including:
- Projecting meaningful, but decelerating growth in active customers with a peak around 20M (at the time Chewy had only 11.3M).
- Analyzing its retention curves and blended churn rates, showing first year retention of ~60%.
- Calculating a $65 CAC, $300 PAV, 4 year payback, and 36% IRR for customers acquired in 2018, and how these measures had evolved over time.
- Deriving a customer-based valuation of $3.7B, 74% lower than its market cap at the time.
- Quantifying the effect on valuation and sensitivity analysis for factors such as margins, CAC, and retention.
Five years later, it’s worth looking back to assess the accuracy of the model and update what has happened with Chewy since then.
Active Customers
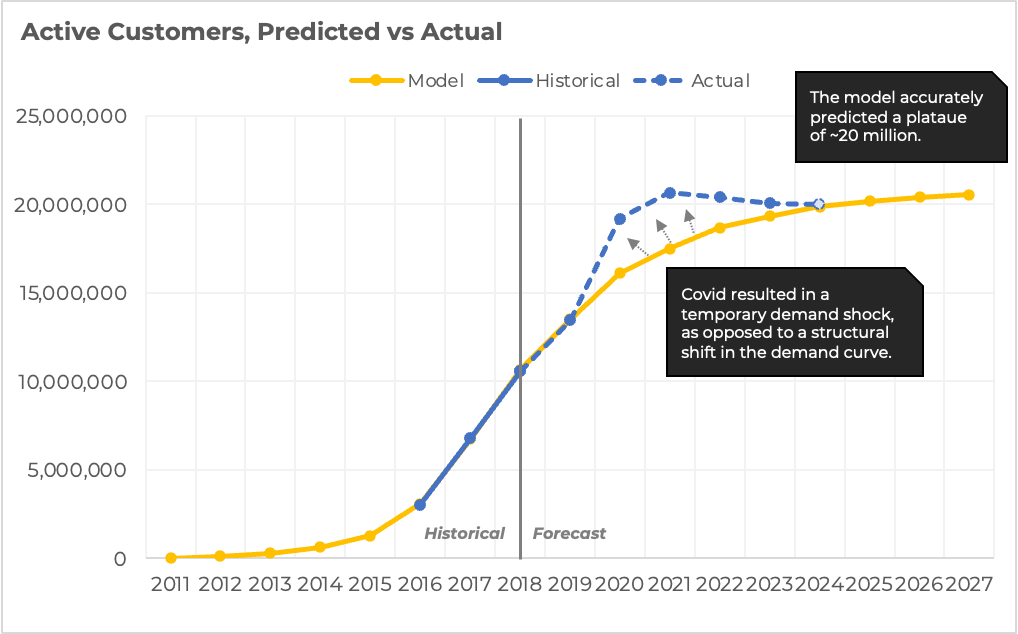
Let’s start with active customers, the most important driver of Chewy’s business and the best measure of the model’s performance2. Here are the model’s predictions versus Chewy’s actual results:

A highly accurate short term prediction
The first thing to note from this chart is the accuracy of the short-term prediction.
2019 Active Customers:
- Projected: 13,513,058
- Actual: 13,459,000
- Difference: -54,058 (-0.4%)
It is notable that this model was based on data up to 2018 when active customers were only 10.6M. Predicting active customers of 13.5M for the next year within 0.4% demonstrates the impressive accuracy of this methodology.
Accurately modeling the long term plateau
Another key takeaway from the chart is how well the model projected Chewy plateauing around 20M active customers. While covid resulted in a demand shock that brought forward some customer demand and accelerated the pace of adoption (see next section), it is remarkable to see that Chewy’s active customers indeed peaked at almost exactly 20M.
It’s worth emphasizing again that this projection was made when active customers were just 10.6M and prior to Chewy hitting the inflection point on the adoption S-curve (still growing but fewer and fewer new customers added each year).
This shows that by understanding market size, adoption behavior, and retention curves, an accurate model of customer growth can be built that projects inflection points such as when a company will hit market saturation. In contrast, most models used in practice by financial analysts miss these critical junctions because they simply estimate growth rates and extrapolate current trends.
The covid story
Chewy was a “covid darling”, with its stock price quadrupling from $30 pre-covid to a high of $120 in Feb 2021. And for good reason - Chewy’s active customers soared from 13.5M in 2019 to 19.2M in 2020, an acceleration in growth far beyond expectations.
2020 Active Customers:
- Projected: 16,123,323
- Actual: 19,206,000
- Difference: 3,082,677 (+16.1%)
The advantage of building this type of model is that it provides a baseline to measure the impact of changes to a business, such covid’s impact on e-commerce. The model’s projections assumed that the basic assumptions and processes of customer behavior would continue. In that sense, the projections were a probabilistic view of Chewy’s future based on what could be observed at the time.
Therefore, any divergences of actual results from the model can be interpreted as changes in business drivers or shifts in customer behavior. Again, this is in stark contrast to typical financial models where differences between actuals and forecasts are primarily because the analyst’s estimates of growth rates were incorrect3.
Since 16.1M active customers were already projected for 2020 using statistical models fit on data from ‘normal’ times, we can thus quantify that the first-year impact of covid on Chewy was an additional 3.1M new customers in 2020.
Where did these additional 3.1M customers come from?
At a macro-level, Chewy benefited from two major trends at the start of the pandemic: the surge in pet adoptions and the shift towards online shopping for pet supplies.
Breaking down the sources of these new customers:
- New pet owners. As people spent more time at home, many decided to adopt pets, creating a new pool of customers for Chewy. According to the APPA National Pet Owners Survey, the % of US households with pets increased from 67% in 2018 to 70% in 2020. This translates into an incremental ~3.8M more pet households. Of course, Chewy did not capture 100% of these new households, but it is reasonable to assume that a large number of these new pet owners at least tried Chewy in 2020.
- A shift to online purchases. the same APPA survey reported that pet owners shopping online increased from 60% to 86%. From a customer modeling perspective this demand shock can be decomposed into:
- Customer reactivation: Previous customers who had churned may have returned due to the necessity of online shopping during lockdowns.
- Demand acceleration: Some customers who would have eventually turned to online pet supply shopping in the future and become Chewy customers decided to do so earlier due to the pandemic, effectively pulling forward future demand.
- Conversion of prior “never-intenders”: Individuals who previously never intended to purchase from Chewy may have been compelled to try Chewy due to limited in-store shopping options.
The rest of Covid - when tailwinds become headwinds
While the start of covid was a boon for Chewy as it acquired a huge number of incremental customers, the reversal of covid trends meant a challenging time with high churn and fewer additional new customers.
As the lockdowns ended and covid abated, the percentage of U.S. households with pets decreased from 70% in 2020 to 66% in 2022. This decline represents approximately 3.3 million fewer pet-owning households, impacting Chewy’s customer base and limiting the pool of potential new customers. Additionally, the shift to e-commerce from brick-and-mortar stores partially reversed, further affecting Chewy’s customer base and sources of net new customers.
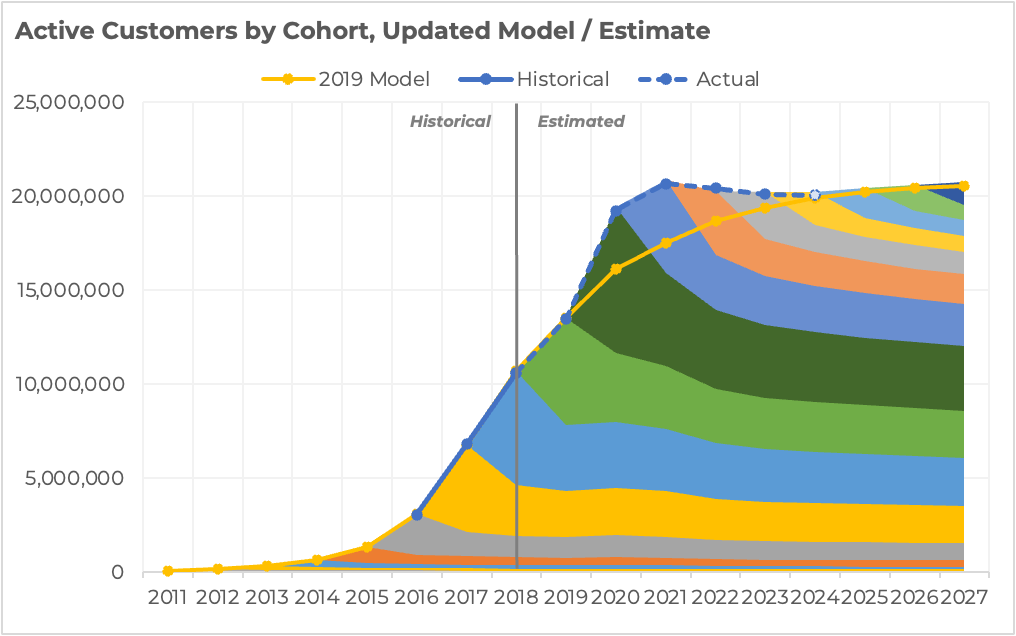
Making some estimates/assumptions around retention curves during covid and customer acquisition sources as noted above (for which the actual breakdown is not available and there are many possible permutations), an updated cohort chart likely looks something like the following:

On the positive, Chewy has an impressive base of active customers with long lifetimes. However, the size of recent new cohorts is declining and barely offsetting churn. This was already projected in the original model and highlighted as an inflection point for Chewy - there are fewer and fewer new customers being acquired each year leading to deteriorating customer economics.
Customer Economics
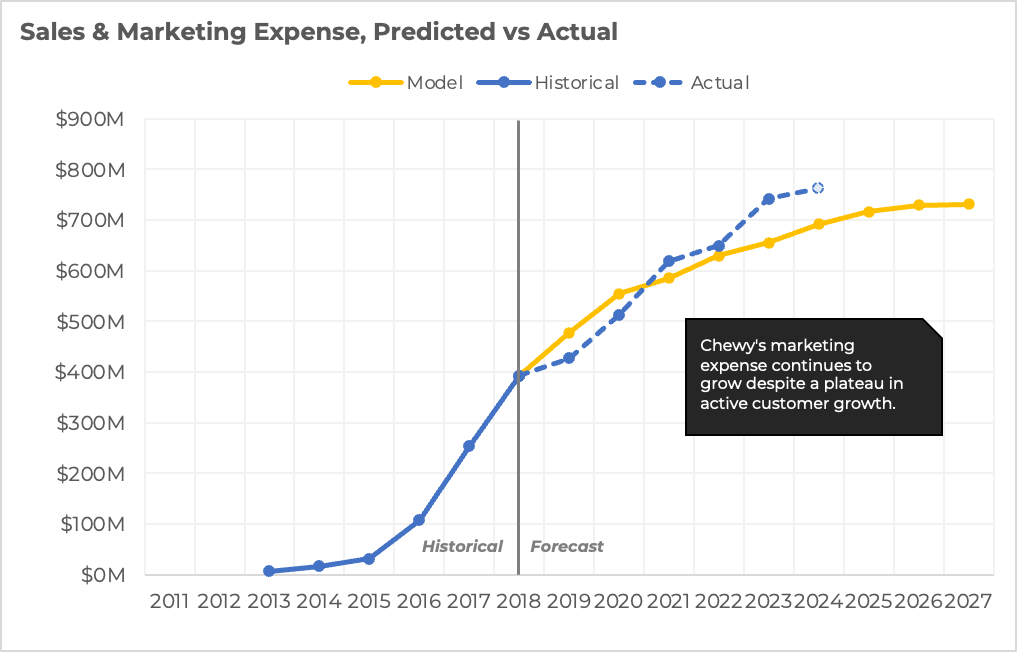
Despite fewer customers being acquired each year since 2020, Chewy’s S&M expense continues to increase, even beyond prior projections:

This means that CAC, from a fully loaded perspective where all S&M is considered CAC, is rapidly approaching Post Acquisition Value (”PAV”) (~$300 as of 2018), if not already exceeding it.
To be fair, strategically it likely made sense for Chewy to increase investment in CAC during a generational opportunity over the last few years. And one could argue that fully allocating S&M to new customer acquisition is no longer the right way to look at the company as retaining its large customer base is presumably a significant target of current S&M expenditures. However, this viewpoint would be partially offset by a hit to PAV on the other side of the equation.
Conclusions
The original analysis from 2019 resulted in a cohort-level understanding of Chewy’s customer processes and economics, a predictive model that can project into the future, and a valuation grounded by the value of its current and future customers.
While covid caused a temporary deviation from the projected path, the model’s fundamental insights about Chewy’s customer dynamics, economics, and valuation held true. It is thus not surprising that Chewy’s stock price has fallen back to pre-covid levels and continues to converge on its customer-based corporate valuation.
The accuracy in predicting Chewy’s customer growth trajectory, both in the short-term and long-term, demonstrates the power of probability models in customer analytics.
-
McCarthy, Daniel and Fader, Peter, Customer-Based Corporate Valuation for Publicly Traded Non-Contractual Firms (March 9, 2018). Available at: https://ssrn.com/abstract=3040422 ↩
-
Modeling active customers is a function of acquisition and retention. These are two distinct processes that drive any businesses - how many customers are acquired and how long do they stick around? Ideally, I’d love to evaluate these separately, but unfortunately Chewy hasn’t disclosed cohorts after its IPO. Thus, active customers is the best measure of the model vs actual results. ↩
-
And then having the gall to proclaim the company missed estimates, rather than the other way around. ↩
Disclaimer: This post is strictly for informational purposes only and should not be construed as investment advice or a recommendation to buy or sell any security. The views expressed herein are the author's alone and do not represent views of any organization or employer the author is currently or was previously associated with. Click here for full disclaimer.